WASHINGTON (BRAIN) — Bike imports continued to skyrocket last year, as the industry brought in bikes with a customs value of $1.96 billion, a record that is 40% higher than in 2020.
Because of a higher average price, the increase in the number of bikes imported was a bit less dramatic. The industry imported 19.24 million bikes, the most since 2010 and a 13.3% increase over 2020.
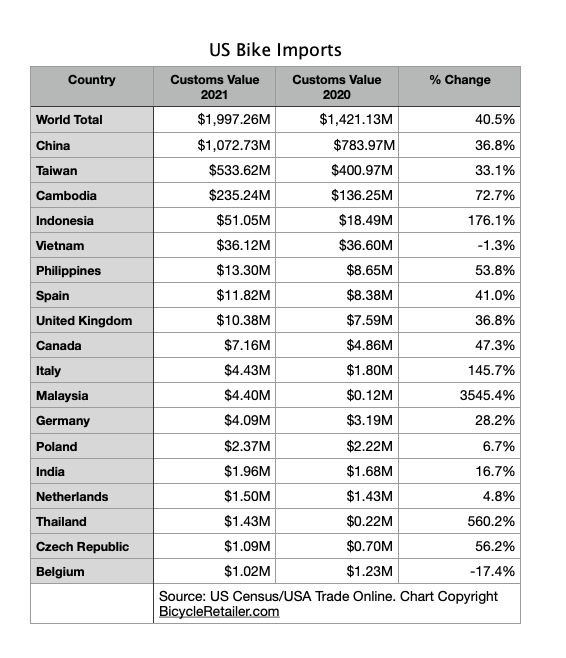
The figures from the Census Bureau’s USA Trade Online database, released Tuesday, show some dramatic shifts in the source nations of U.S. bikes, just in the last two years.
For example, the total value of bikes from China and Taiwan increased 37% and 33%, respectively, from 2020 to 2021. But the third-largest source of bikes, Cambodia, saw a 72% increase, while Indonesia saw a 176% increase. Imports from Vietnam, on the other hand, were valued at 1.3% less than the prior year, likely due to COVID-19-driven factory shutdowns there.
The fine print.
Most bikes sold in the U.S. are imported, making the Customs import figures above useful for identifying large industry trends. We publish monthly detailed bike import data in the Tradewatch feature in each print issue of Bicycle Retailer & Industry News, and we've been doing so for nearly 30 years. Unfortunately, there are several weaknesses to the import data:
- No channel. Customs does not distinguish bikes bound for the IBD market from those headed to the mass market, the sporting goods market or the direct-to-consumer online market. Since the mass market is dominated by sales of millions of low-priced kids bikes, some analysts feel that focusing on adult bike imports may be more fruitful for the IBD market. Using that method: Adult bike sales were up 45.6% by dollars last year, and up 37% by units.
- Little useful categorization. The Customs bike categories, while perhaps useful 50 years ago, have not kept up with industry trends. They are generally aligned with wheel diameter, bike weight, and, in some cases, tire width or tire-width clearance. This makes it hard to distinguish between a 26-inch mountain bike and a cruiser, or a gravel bike vs. a 700c city bike. (Customs does categorize data for some parts and accessories, such as chains, tires and saddles, that can be useful, however.)
- No e-bikes. Our figures cited above do not include the critical, fast-growing category of e-bikes, because in the U.S. e-bikes still share a customs code with electric motorcycles, making it difficult to separate the two without drilling down to analyze individual shipments. The Light Electric Vehicle Association has calculated that the U.S imported 790,000 e-bikes last year, a 70% increase over 2020.
More data information
Today's momentous occasion: the release of annual import figures, is as good a time as any to provide some overview of the data available in the industry.
Besides the import data, there are two other major sources of data for the U.S. market. Both are behind paywalls that prevent BRAIN from publishing more than snippets on occasion. However, industry members can access more of this data by contracting with The NPD Group and/or joining PeopleForBikes.
The NPD Sell-Through Report relies on a sampling of sales of products and services at participating retailers in all channels. The samplings are weighted to estimate national figures. Some industry analysts question some of the estimates, pointing out that some major retail owners are reluctant to have their stores participate. However, the NPD Group is respected across many industries. Corporate NPD subscribers can get Sell-Through data that includes details down to the brand level. PeopleForBikes business members have access to some unbranded Sell-Through data, which the group publishes on its online Business Intelligence Hub, along with other data. NPD generously allows us to include some monthly Sell-Through highlights in our Dashboard feature in each print edition of Bicycle Retailer & Industry News. (Editor's note: If you've read this far you probably qualify for a free subscription to the magazine. Check out subscription options at subscribe.pcspublink.com.)
The PeopleForBikes Sell-in and Inventory Report is compiled by the NPD Group for the trade organization and includes actual (not sampled) data from wholesalers who participate. The figures show products sold in to the retail channel and the dollar value and unit count of bikes in wholesalers’ inventory. The Sell-in report has a long history as it was previously compiled by the Bicycle Product Suppliers Association, which PeopleForBikes absorbed in 2019. Occasionally some companies stop or start reporting to the program, which can lead to weird data that PeopleForBikes does its best to account for while preserving anonymity. PeopleForBikes generously allows us to publish monthly total sell-in and inventory dollar figures in BRAIN’s monthly Dashboard feature, but there are many other details available to members.
For bicycle consumer data, the National Bicycle Dealers Association's recent Bicycle Buying 2021 Consumer Research Study is the most detailed report in years. A dealer version is available to NBDA members for $399.

-
 Click it.
 -
 Click it.


